
Reading the book on a chart you already have

You will not get a full book for a currency pair, and you do not need one. The board leaves fingerprints on every chart you already own. This lesson teaches you to read them, so you stop paying for a window that only shows one stall.
Why you cannot see the whole board, and why that is fine
Forex has no single exchange. Each bank and broker runs its own board, so nobody sees every pin at once. What your broker shows as Depth of Market in MT5, if it shows one at all, is that broker's own book or a slice of the feed it buys: one stall in a market of thousands. Paid retail book products for forex are the same thing with a nicer chart.
You do not need to see the pins. You need to recognise what the chart looks like when pins were thick, thin, or being swept. The four clues below are on every MT5 chart already.
Four clues on a plain chart
1. Volume
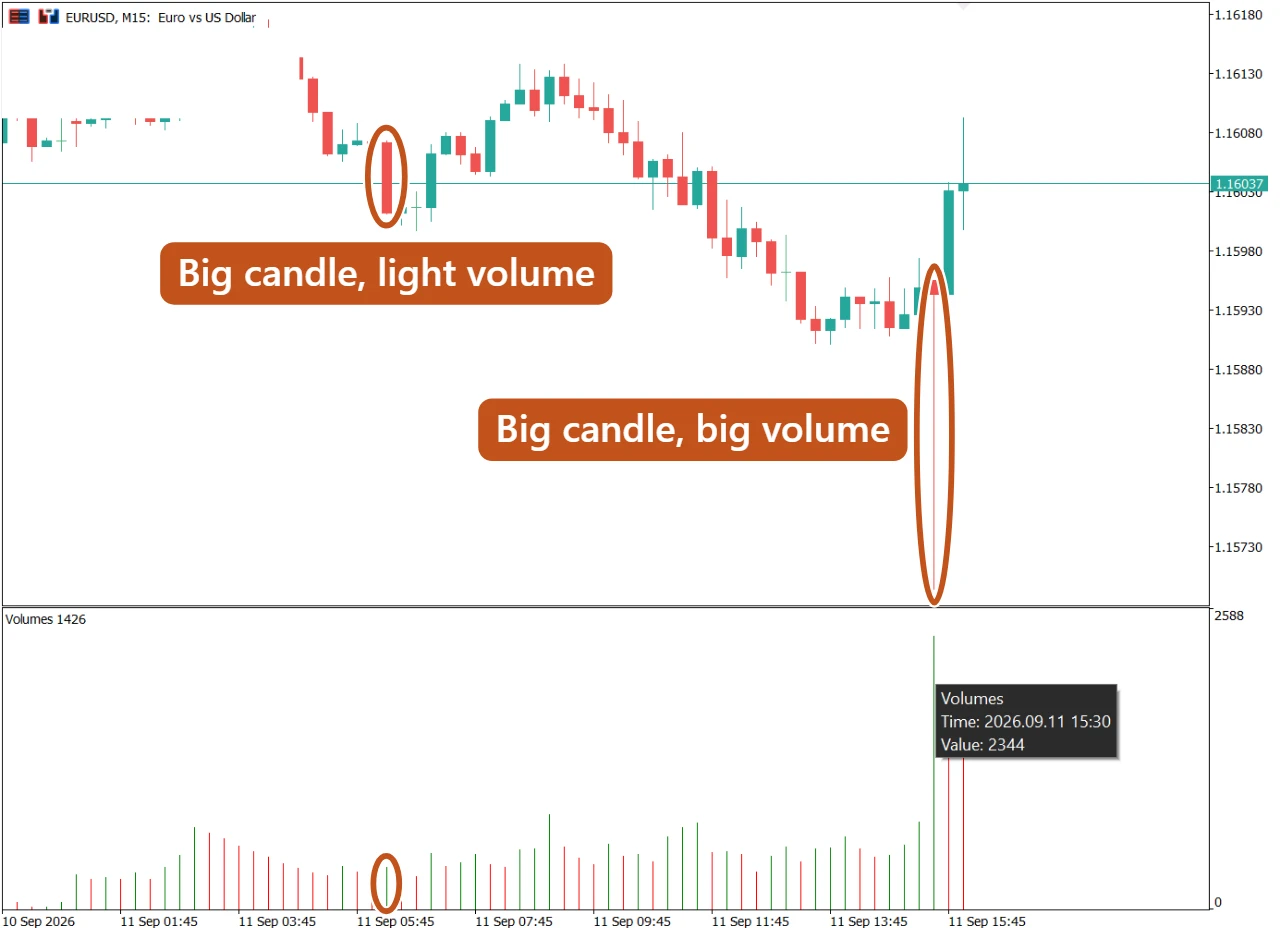
MT5 shows tick volume, the number of price changes in each candle, not the number of bags. It is a proxy, and a decent one. Turn it on from the Charts menu, Volumes, Tick Volume, or press Ctrl and L. A big candle on high tick volume says the book was busy and got eaten anyway. A big candle on thin tick volume says the board was empty and a small push travelled a long way.
2. Spread behaviour
Lesson 2 showed you the Spread column in Market Watch. Watch it against the clock. A spread that suddenly doubles with no news is the front of the board stepping back, and whatever candle prints in the next minute is printed on a thin book.
3. Wicks
A long wick is the board being pushed through a stretch and pushed back. A long lower wick under a level you were watching, with a close back above it, is the picture from lesson 7: the sleeping stops were swept and the buy limits underneath absorbed them. A long upper wick at a round number is the mirror image.
4. Gaps and straight-line candles
A gap at the Monday open, or a candle body with no pause in it, is a run of empty rungs, as lesson 6 showed. A stop placed inside that stretch would have filled at the far end of it.
| Clue | Where to find it in MT5 | What it usually means on the board |
|---|---|---|
| Tick volume | Charts menu, Volumes, Tick Volume | How busy the book was during that candle |
| Spread | Market Watch, right-click, tick Spread | How far the front pins have stepped back |
| Wick | Any candle | A push through a stretch, then fresh pins pushing back |
| Gap or straight body | Any candle, especially Monday open | Empty rungs that price skipped |
Putting the clues together
Reading one candle with the board in mind
- GBP/USD, 15 minute chart, late evening Lagos time. A candle drops 40 pips with a long lower wick and closes back near its open.
- Tick volume on it is lower than the candles either side. The spread column had widened to three times its daytime figure.
- The low of the wick sits just under a round number that held twice earlier in the day.
- Reading: a thin board, a modest sell, a cluster of sleeping stops under the level, then thick buy limits absorbing the crowd and price snapping back.
None of that tells you what the next candle does. It tells you the move was a sweep through a thin book rather than a crowd of new sellers, which changes where a sensible stop for the next trade belongs.

If you finish this module thinking you can now see where price is going, read it again. What you can see is why it went where it went, and where the crowd is standing. That is enough to stop you standing with them.
The picture to keep
You cannot see the noticeboard from where you stand, but you can see the footprints in the sand in front of it: how busy it was, how far apart the front pins were, and where the crowd pushed and got pushed back.