
Getting around MT5

Every trader I have watched struggle with MetaTrader 5 was fighting the layout, not the market. Learn where the four windows are and what each one is for, and the platform stops feeling like a cockpit and starts feeling like a shop counter.
The four windows
Open MT5 for the first time and you see four panels. On the left, top, is Market Watch, the price board. Under it is the Navigator, the storeroom. In the centre are the chart windows, the goods on display. Along the bottom is the Toolbox, the ledger where every order, every fill and every message is written down.
Each one can be closed by accident and reopened from the View menu. Learn the three shortcuts and you will never lose a window again.
| Window | What it is for | Open or close it |
|---|---|---|
| Market Watch | Live Bid and Ask for every symbol you follow | View > Market Watch, or Ctrl+M |
| Navigator | Your accounts, indicators, scripts and any software | View > Navigator, or Ctrl+N |
| Chart window | One symbol, one timeframe, where you read price | File > New Chart, or drag a symbol from Market Watch |
| Toolbox | Trade, History, Alerts, Journal and other tabs | View > Toolbox, or Ctrl+T |
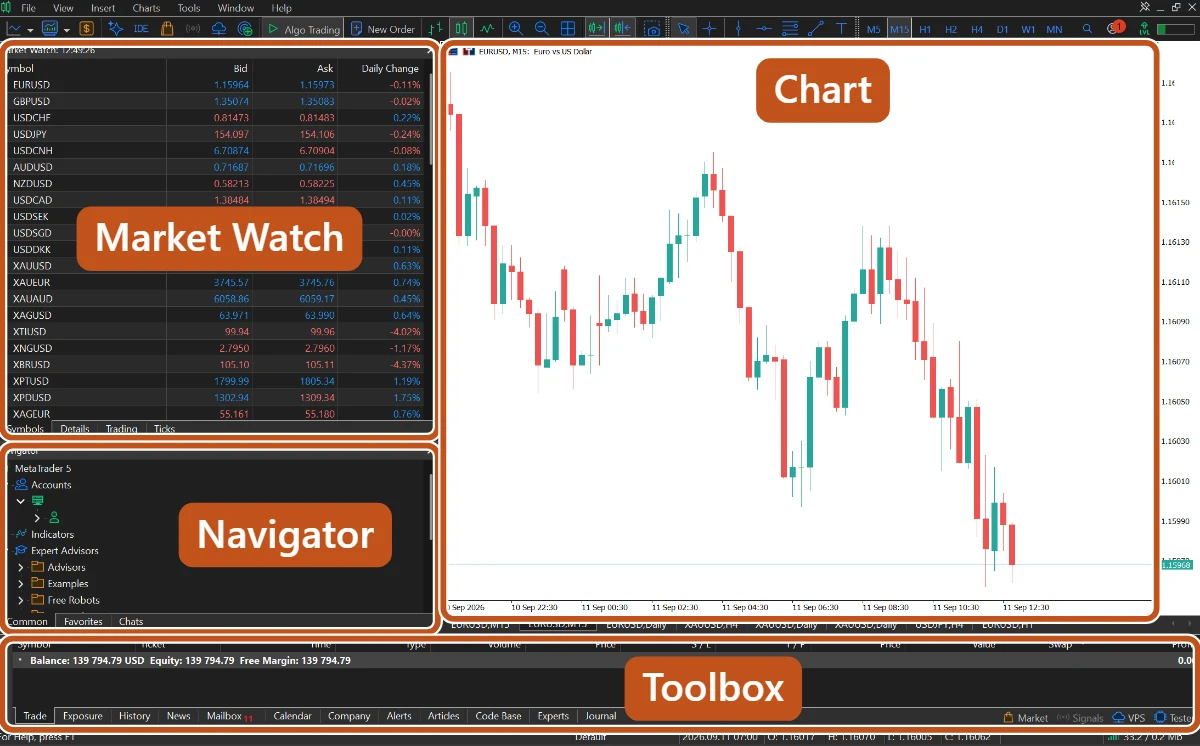
Market Watch, the price board
Market Watch lists symbols with their Bid and Ask. Right-click inside it and tick Spread to add a third column, so the cost of every symbol is on the board before you touch a ticket. The lesson on bid, ask and spread explains what those two prices are.
- Right-click > Symbols (or Ctrl+U) opens the full list from your broker. Tick the ones you trade and hide the rest.
- Right-click > Show All puts every symbol on the board. Useful once, cluttered forever after.
- Double-click a symbol to open the New Order window for it. Drag a symbol onto the chart area to open its chart.
- Right-click > Specification opens the contract details: digits, minimum volume, stops level, filling modes, trading sessions. This module comes back to that window several times.
The small clock in the Market Watch title bar is the broker's server time, not Lagos time. It matters later, when an order expiry is set by the server's clock.
Chart windows
A chart shows one symbol on one timeframe. The timeframe buttons on the toolbar run from M1 (one-minute candles) to MN (monthly). Open charts sit as tabs along the bottom of the chart area, so you can switch between them like browser tabs.
Right-click anywhere on a chart and the menu offers Trading > New Order as well as a quick list of pending orders at the price you clicked. That is the fastest way to place an order while you are looking at the level it belongs to.
Two or three charts, each for a symbol you actually trade, is enough. Twelve charts on one screen is how people click the wrong one.
The Toolbox, your ledger
The Toolbox carries a row of tabs. Four of them matter every single day.
- Trade: your account line (Balance, Equity, Margin, Free margin, Margin level) with every open position and every pending order listed under it. Right-click a row to modify or close it.
- History: everything that has already closed. Right-click to choose the period. Module 11 turns this tab into a journal.
- Alerts: price alerts you set so the platform watches a level while you do something else.
- Journal: the platform's own diary. Every connection, every order sent and every reply from the broker is written here with a time stamp. When an order is refused, the reason is in this tab.
You will also see Exposure, News, Calendar, Mailbox, Experts and others. Leave them alone until a later module asks for one.

The Navigator, and the one check that matters
The Navigator is a tree. Accounts lists every login you have saved, with the active one highlighted. Indicators, Expert Advisors and Scripts are tools you can drag onto a chart. For this module, Accounts is the only branch you need.

Look at the account number in the Navigator and the title bar before you place anything. A demo account and a live account are identical on screen, and I have seen a practice order placed with real money because nobody looked.
The picture to keep
MT5 is a market stall. Market Watch is the price board, the chart is the goods on display, the Toolbox is the ledger, and the Navigator is the key to the storeroom.