
Setting up a clean chart, templates and profiles

A chart with nine indicators on it is not more informed. It is more crowded. This lesson is about making a chart you can actually read, then saving it so you never have to build it twice.
Start with less on the chart
Press F8 on any chart to open its Properties. The Colors tab sets the background, the candle colours and the grid. The Show tab is where the clutter lives: untick Show grid and Show volumes unless you use them, and keep Show trade levels ticked so your stop loss and take profit are always visible as lines.
Use Alt+2 for candlesticks, Alt+1 for bars, Alt+3 for a line. Most traders never need more than the candles, one moving average if their plan uses one, and the trade levels. Everything else is decoration that hides price.
A clean chart is like a tidy market stall. The customer can see the rice, the price, and the scale. Nobody is helped by fourteen signs.
Templates: save the look once
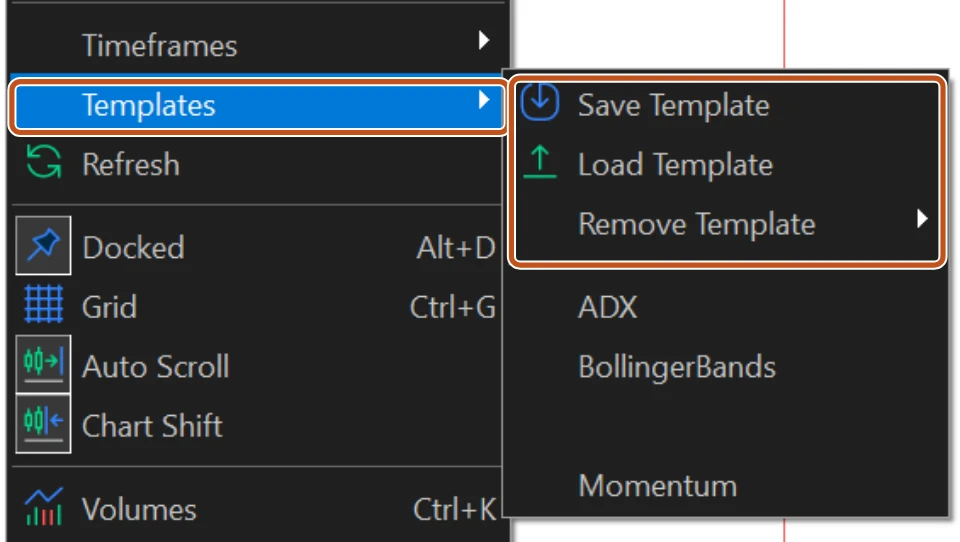
A template is a saved chart set-up: chart type, colours, indicators with their settings, and any program attached to the chart. Build a chart the way you want it, then right-click it and choose Templates, Save Template, or use the Charts menu, Templates. Give it a name like Clean or London Plan.
- Set up one chart exactly as your plan needs it.
- Right-click, Templates, Save Template, and name it.
- On any other chart, right-click, Templates, Load Template, and pick that name. The chart takes on the look at once.
- Save a template named Default. MT5 applies the template called Default to every new chart you open, so your clean set-up becomes the starting point rather than the platform's own.
Profiles: save the whole desk
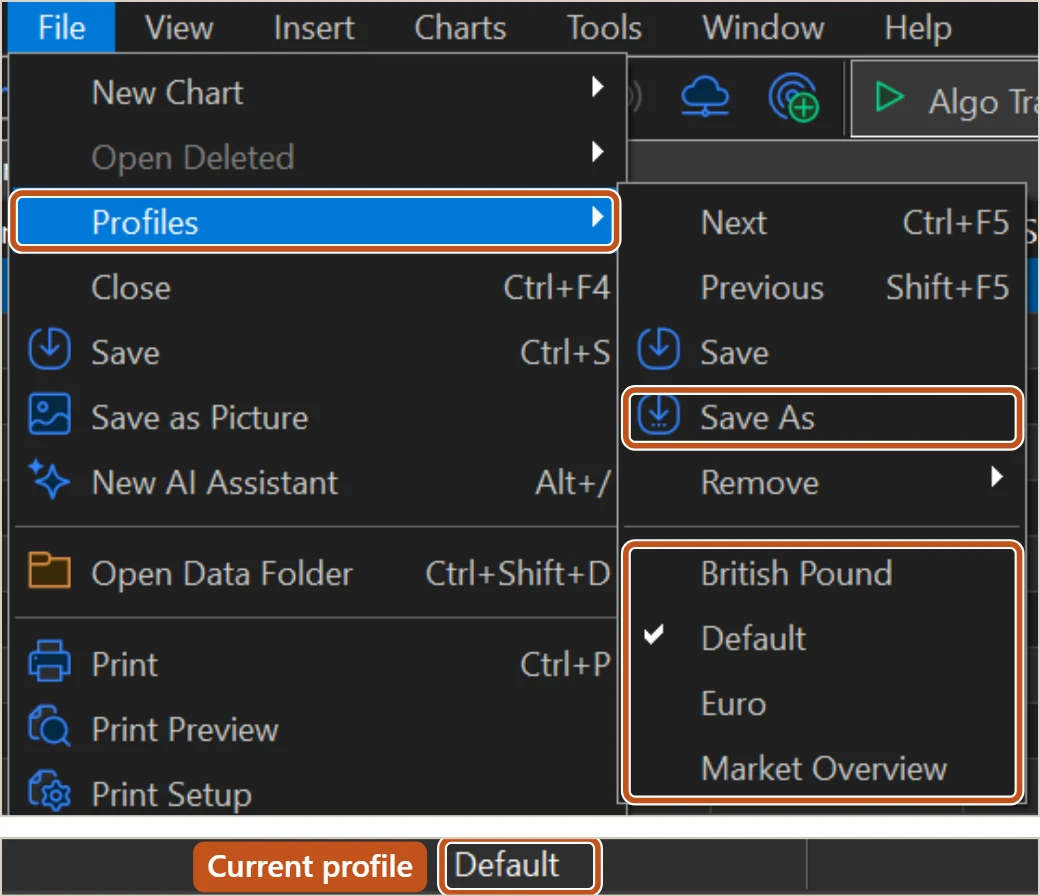
A template is one chart. A profile is every chart you have open, which symbol and timeframe each one shows, how the windows are arranged, and which template each carries. Go to File, Profiles, Save As and name it. The name of the current profile shows in the status bar at the bottom of the terminal, and clicking that name lets you switch.
| Profile name | What it holds |
|---|---|
| London | The three pairs your plan trades in the London session, each on the fifteen minute and the hourly, tiled side by side |
| New York | The pairs and indices you watch after two in the afternoon, same layout |
| Review | Daily charts of everything you traded this week, for the weekly review, no indicators at all |
Switching profiles takes one click and rebuilds the whole workspace. That matters on a slow laptop, and it matters more for discipline: the London profile only shows the London plan, so the chart you were not meant to be trading is not even on the screen.
Small things that keep it clean
- Window, Tile Windows arranges every open chart into an even grid.
- The Chart Shift button on the toolbar leaves a gap to the right of the last candle, so the current price is not jammed against the edge.
- Ctrl+Y draws period separators, faint vertical lines at each day or week, which makes sessions easier to see.
- Profiles and templates live in the terminal's own data folder, so a fresh install on a new laptop starts from nothing. File, Open Data Folder shows you where they are if you ever want to copy them across.

Adding another indicator does not add another edge. If your plan cannot be read from a clean chart, the problem is the plan, and no amount of colour on the screen will fix it.
The picture to keep
A template is one tidy stall. A profile is the whole market laid out the way you work it, and it reopens in one click on a Monday morning.